Free Library resources for term papers exploring the roots of the rage at the extrajudicial killings of black men and black children in the United States. Part 6: Appendix and Postscript
By Adam F.[Editorial Note: This is the sixth and final edition of a six part series intended to demonstrate for teachers and students the use of special Free Library of Philadelphia resources for conducting research into issues raised by events in Ferguson, MO during the last 4 months of 2014. In the wake of failure to indict police officers in the case of Eric Garner's death, the shocking last few seconds of Tamir Rice's life, and uncountable or at least uncounted other deaths, this posting carries an altered title from the first few of the series. This series covers gathering background information, finding and acquiring books, finding and acquiring periodical literature, accessing the newspaper record, utilizing primary sources, and finally adding interesting data and other materials in an appendix or elsewhere within the text of a paper.]
Appendix 1: Statistics
Students and other researchers are often hungry for raw data with which to examine an issue. “Where can I find statistics on X?” is an extremely common question. Historically, there was no better starting point for answering than the Census Department’s Statistical Abstract of the United States. Unfortunately, due to a mix of austerity and the ideology of privatization the Census no longer publishes this invaluable digest of data collected by the government. Instead, production of an abstract is now in the hands of Proquest and Bernan. The Free Library does not subscribe to this once free resource that Proquest now sells, so alternate strategies must be employed. One can still consult the alphabet soup of government agencies for the individual departmental reports summarized by previous Abstracts.
Fortunately, the Free Library does subscribe to a business database called BusinessDecision, which can help with some demographic, economic, and other data. This database puts a powerful data crunching tool in the hands of researchers as well as entrepreneurs who are trying to understand a local market. To demonstrate its usefulness outside of business topics, I used BusinessDecision to generate a series of “Graphic Reports” about the one square mile areas around where Michael Brown died in Ferguson, MO and where Eric Garner died in Staten Island.
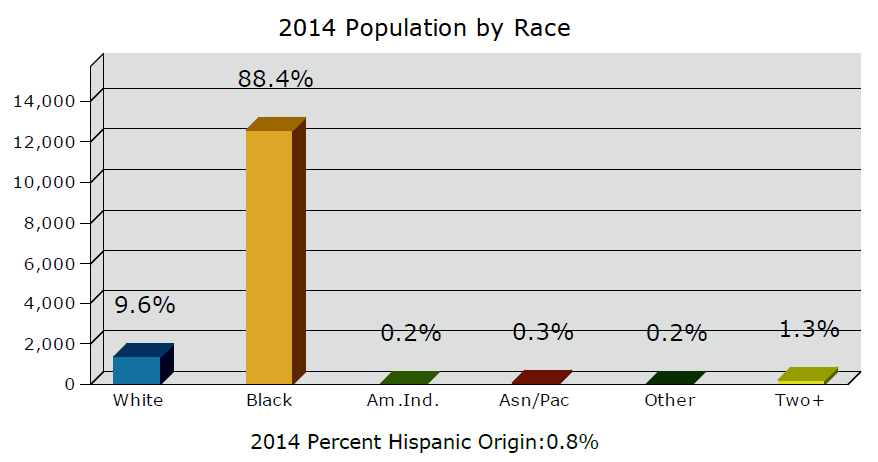
First, let’s take a look at the state of segregation and integration in the square mile surrounding the shooting of Michael Brown and the choking death of Eric Garner.
1 Mile Radius of 2900 block of Canfield Drive Ferguson MO 63136
1 Mile Radius of 202 Bay St Staten Island, NY 10301
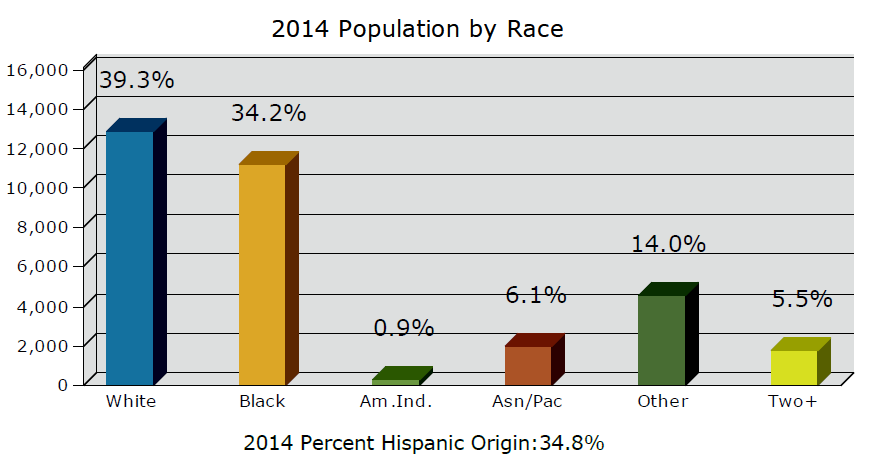
What questions do the demographic differences of each location raise? As the first chart illustrates, the neighborhood where Michael Brown lost his life is quite racially homogenous as compared to the section of Staten Island where Eric Garner drew his last breath. Do the 4.5 minute #DieIn protests sweeping the country memorializing the 4.5 hours that police left Michael Brown’s lifeless body in the street grow in significance if we ask the question: Was the predominantly white police force sending a message to black residents? Or was leaving a body exposed for so long proper procedure when investigating a shooting? Or if these questions are off the mark are there other questions provoked by the demographic composition of the area surrounding each crime scene?
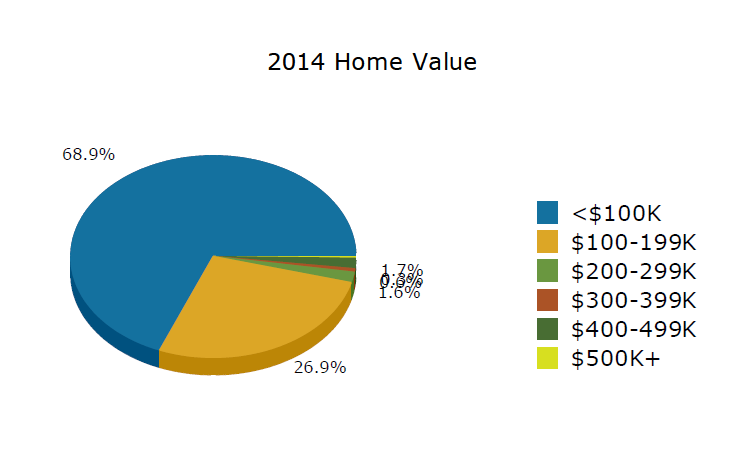
Conversely, Eric Garner appears to have been in a stretcher in the care of emergency medical personnel within seven minutes of being handcuffed motionless. Even if police on Staten Island appear eager not to have an audience maybe there are pieces to the context that data might reveal? Michael Brown died among apartment complexes on a residential street, whereas Eric Garner died on busy commercial street. The value of homes in the surrounding neighborhood vary widely. Is there a correlation between value of property and the kind of policing that protects it?
1 Mile Radius of 2900 block of Canfield Drive Ferguson MO 63136
1 Mile Radius of 202 Bay St Staten Island, NY 10301
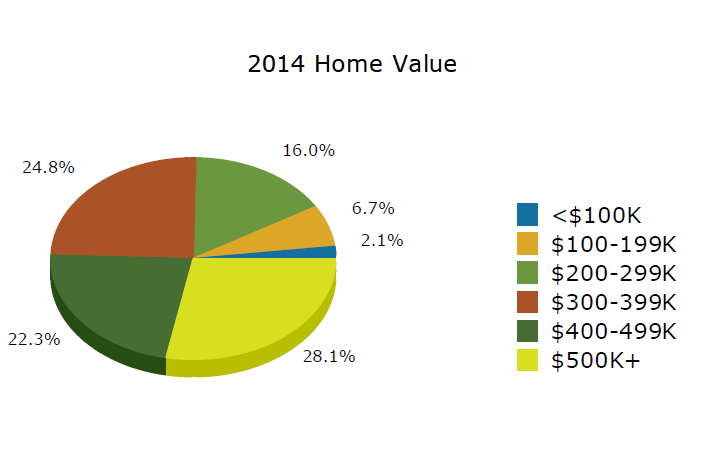
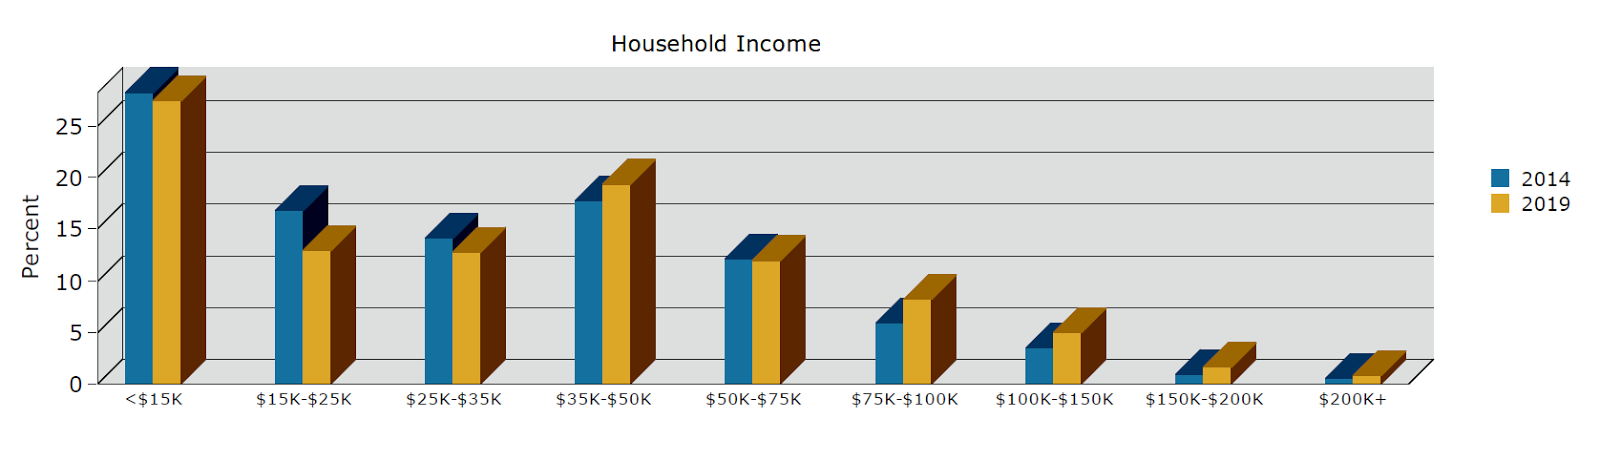
Nearly 96% of the homes in this section of Ferguson have a value under $200,000. Whereas only 8.8% have a similar value in this section of Staten Island. Even though household incomes are higher in this neighborhood of New York City than this suburb of St. Louis, it would seem there must be an affordability problem. How else might housing characteristics be important in understanding each incident? Does this context matter?
Income-wise, the contrast between a slope of inequality in this slice of Missouri and an at least moderate middle class bell curve in this section of New York City is fairly apparent.
1 Mile Radius of 2900 block of Canfield Drive Ferguson MO 63136
1 Mile Radius of 202 Bay St Staten Island, NY 10301
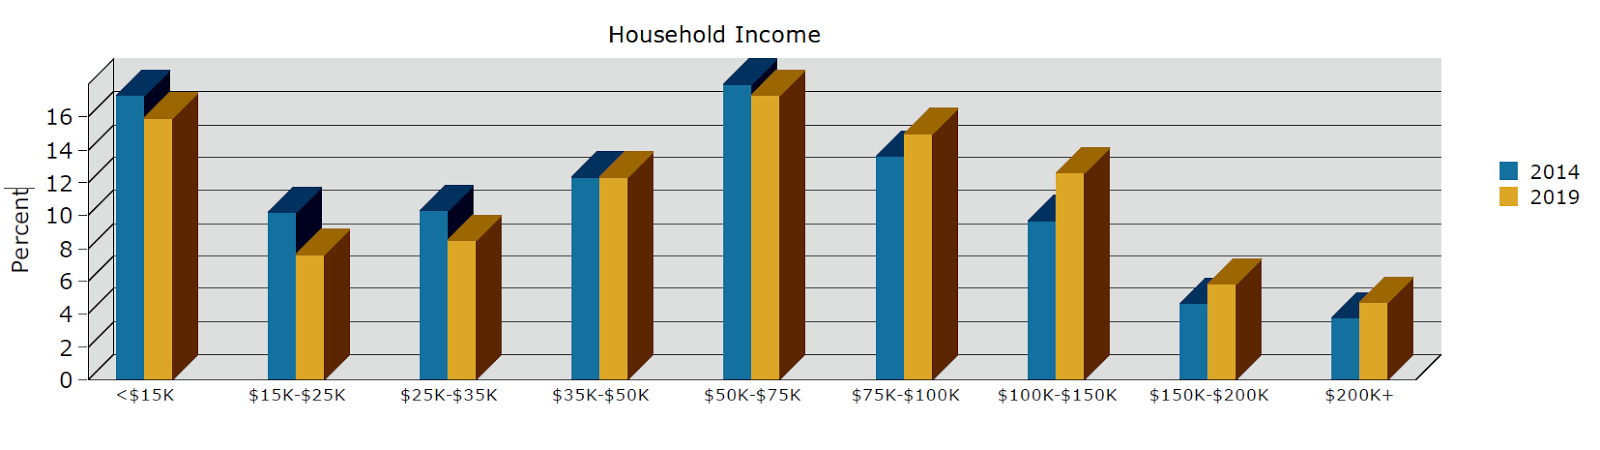
In fact, the challenge of affordability does raise questions about an economy that puts a married father of six in a position where selling cigarettes in competition with licensed tobacco vendors becomes a tool of survival. How do families make ends meet in an expensive city where a quarter of the population in the surrounding area earns less than $25,000 a year? Charts such as these can not only provoke questions for a researcher, they can also add a graphic punch to an argument the writer might choose to make.
Appendix 2: Maps
A different sort of tool for survival in the kit of researchers and nonprofit workers in Philadelphia is the Central Library’s Regional Foundation Center. One of the databases, Foundation Maps Professional, could be used to generate interesting maps analyzing the level of government and foundation investment in a community. This map below shows the number and dollar value of grants made recently in Ferguson. Looking at each individual giver reveals other kinds of clues as to the civic, municipal, and other community priorities in an area.
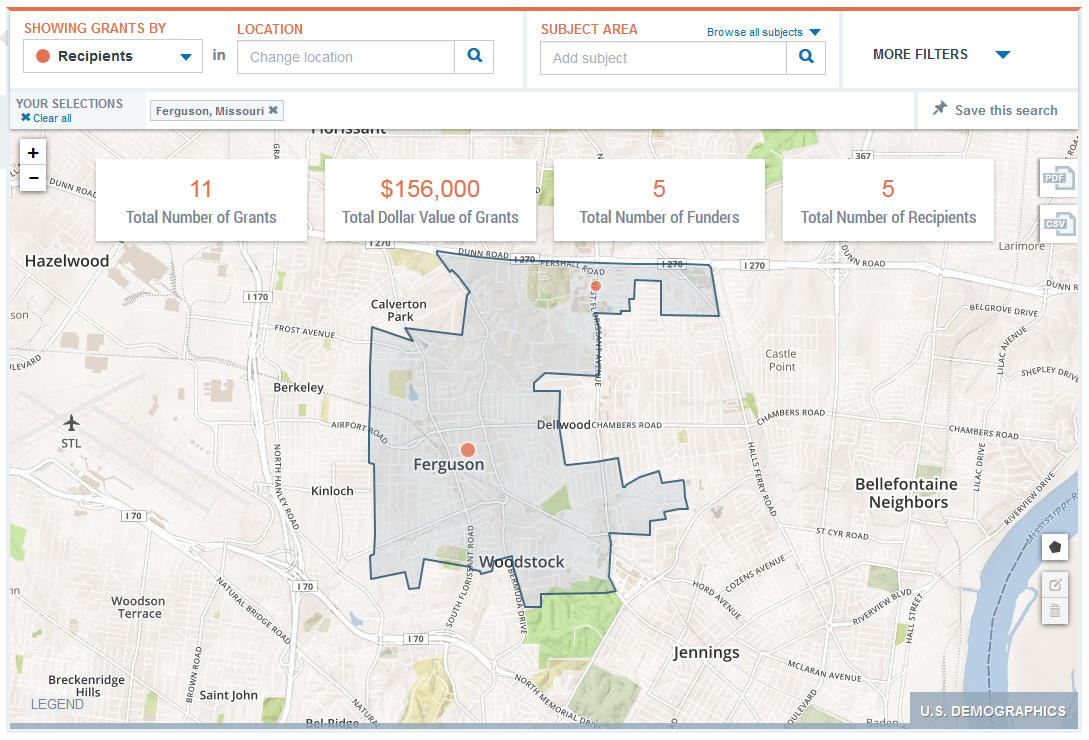
Foundation Maps Professional accessed 11/29/2014
Maps can also be used to trace changes in the environment and human beings’ use of it. The Free Library’s Map Collection is extremely useful in this regard. Researchers with a library card can access one tiny portion of this collection by using Sanborn Maps Geo Edition (1867-1970) on our database page.
This database includes scans of maps of 202 Bay St on Staten Island (officially known as Richmond County) New York from 1885, 1898, 1917, 1937, and 1951. In 1885, 202 Bay Street appears to be a woodworking shop in the bottom lefthand corner.
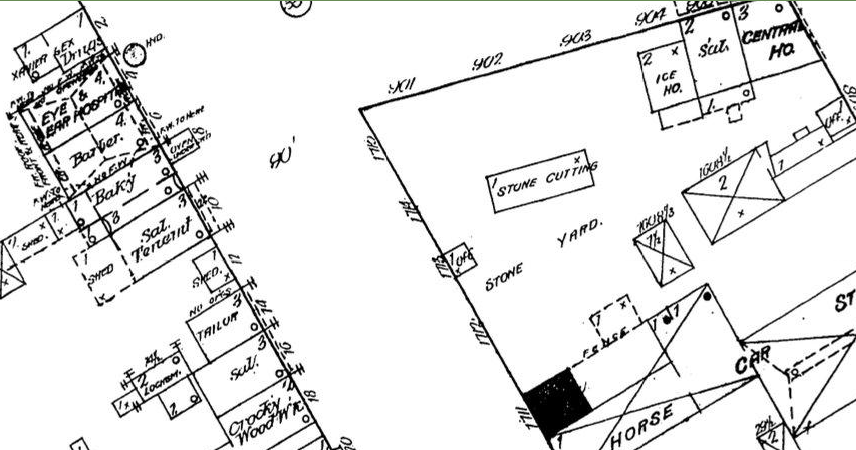
Sanborn Fire Insurance Map Company. Sheet 00008. Richmond Borough of New York City, Borough of Richmond, New York 1885.
By 1951, notice how a leisure and beautification amenity such as Tompkins Park has replaced a mix of industrial uses of land as captured by the 1885 map above.

Sanborn Fire Insurance Map Company. Sheet 00019. Richmond Borough of New York City, Borough of Richmond, New York 1951.
For some students and researchers this might lead to new questions about how the built environment shapes our use of space, our right to occupy it, or the means by which we derive our livelihood from it. Again, this just hints at the possibilities of maps as an illustrative addition to a research paper. Visit a library and speak with a librarian for more ideas.
Appendix 3: Photographs
Throughout this series at the end of each section, I’ve included a description of photograph or illustration to demonstrate the way graphic documents can deepen a point or be used as an object of analysis. Everything, thus far, has come from our own Free Library of Philadelphia's Digital Library Collections.
The Associated Press, a newsgathering cooperative, is the world’s oldest wire service. Philadelphians are very lucky to have access to one of its rich databases of historical and contemporary news photos: AP Images (formerly AccuNet/AP Multimedia Archive). Librarians highly encourage students and teachers to search through it for photographic documentation for the illumination of the past and present.
Searching for “Police Brutality” and sorting images by date lead me to highly three interesting historical moments included to the right to illustrate the editorial power of news photos. Each comes with a detailed caption as well as subject tags for finding other similar images.
The first photo at the top right has the following caption:
An unidentified Chinese-American holds his head as blood streams down his face after he was injured during a demonstration near New Yorks City Hall, Monday, May 19, 1975, New York. More than 5,000 Chinese-Americans took part in the rally which was staged to protest alleged discrimination and police brutality.
(AP Photo Monday, May 19, 1975)
Here in 1975 we have a record of a shocking moment when the Chinese-American community is marching in response to discriminatory treatment. As the protester falls into the grasp of the police officer others in the street can be seen reaching out to comfort him. Among the violence he faces exerting his democratic rights, we can see a moment of tenderness.
A similar moment of tenderness despite obvious pain is captured in the second photograph at the middle right. A white civil rights protester can be seen holding the hand of a woman who’s out of frame injuries are severe enough to force her completely off her feet.
Blood pours from the head of a civil rights protester who was injured by police during a mele near the World's Fair stop at 74th St. station of the IRT subway line in Queens, New York, April 22, 1964. Protesters were attempting to hold up trains to the fair when they were physically ejected from the subway cars by police.
(AP Photo/John Lindsay Wednesday, April 22, 1964)
We can see from this photograph that disrupting transportation in the name of demanding that everyone turn their attention to the human rights of African Americans has at least a 50 year history. In the Bay Area, protesters recently disrupted service on the Bay Area Rapid Transit System in order to draw similar attention to human rights for black people in the United States.
Finally, in the the third photograph, we can see that racist attention to the style or clothing choices of youth of color is far older than the contemporary obsession with hoodies and sagging pants:
These youths, one stripped of all his clothes, the others badly beaten, fell victim to ranging bands of policemen who scoured the streets in Los Angeles June 7, 1943, ferreting out and beating zoot-suited young hoodlums they blame for the numerous recent unprovoked assaults. Fifty or more zoot suiters had their clothing torn from them, police reported.
(AP Photo/Harold P. Matosian. Monday, June 07, 1943)
Police rioting during the famous Zoot Suit riots stripped naked Latino and African American youngsters out of hatred for the fad of the Zoot Suit and the subcultural power it represented.
Appendix 4: Archival Research
The summit of research occurs in archives and special collection libraries. Philadelphians are fortunate to live in a city rich with opportunities to do original research in these historical repositories. The Philadelphia Area Consortium of Special Collection Libraries offers a gateway to finding the appropriate collections for a particular topic.
Besides visiting one of these collections, researchers just dipping their toes into archival waters could consider experimenting with our database: In The First Person: Index to Letters, Diaries, Oral Histories, and Other Personal Narratives
In the First Person can help give leads, some time with full text online, to various primary documents held in special collections around the world. Searching for “police” in this index leads to some promising collections:
Term
All
Text
Audio
Video
African American police--New York (N.Y.)
1
Police
16
13
1
Police forces
22
22
Police inquiries
5
5
Police misconduct
1
Police officers
44
44
Police--New York (N.Y.)
1
Washington, DC. United States Capital Police
8
8
Post Script
We started this series with song, so it seems fitting to let J. Cole have the final word:
![AP Photo Monday, May 19, 1975 [see Appendix 3 for full caption]](https://libwww.freelibrary.biz/images/blog/FLPBlog/orig/ChineseProtestor_3.jpg)
![AP Photo/John Lindsay Wednesday, April 22, 1964 [see Appendix 3 for full caption]](https://libwww.freelibrary.biz/images/blog/FLPBlog/orig/SubwayProtest.jpg)
![(AP Photo/Harold P. Matosian. Monday, June 07, 1943 [see Appendix 3 for full caption]](https://libwww.freelibrary.biz/images/blog/FLPBlog/orig/ZootSuit_2.jpg)
Have a question for Free Library staff? Please submit it to our Ask a Librarian page and receive a response within two business days.